Introducing "Twitty City", a geographical Twitter sentiment tool
On December 4th I participated in the Oxford Open Data Hackathon Day, a gathering with the purpose of exploring public data and presenting it in interesting ways. Earlier that week, Tim Davies informed me of an API to analyse the sentiment of tweets, which gave me the idea of using it to determine the mood of a city in real time. And thus, Twitty City was born.
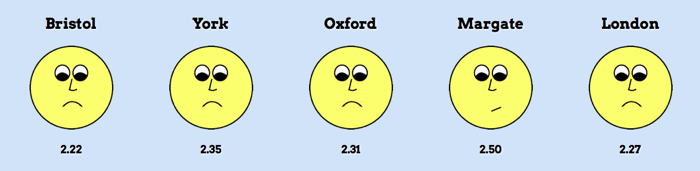
Twitty City is a small web app which, for five cities:
- Collects tweets geolocated to that area;
- Submits the last hour’s tweets to an API for sentiment analysis and computes an average sentiment value;
- Displays a smiley face appropriate to the average sentiment; and
- Graphs the previous week’s average sentiment scores.
I chose to write Twitty City for the Google App Engine for two reasons. First, price - the App Engine free tier is quite generous, and amply meets the needs of a small application. Second, Python - I use PHP all the time in my day job, and it’s nice to have an excuse to explore a different language. My main grievance with App Engine is that (at time of writing) the servers are running Python 2.5.2 but the SDK is running v2.6, so it’s very easy for an inexperienced Pythonista like me to have a false sense of security about the availability of certain libraries (I’m looking at you, json).
I’ve put the source code on GitHub, partly out of vanity, partly to gain practice with Git, but primarily so that people who want to analyse other cities can have a good starting point. Overall, I had a great experience writing this app, and I’m already thinking of how I’ll next improve it.
Photos from the event can be found here. I really enjoyed meeting so much of the Oxford geek community, and am looking forward to seeing them again!